
FELT EFFECTS OF THE DUMFRIES EARTHQUAKE OF 26 DECEMBER 2006
The earthquake of the 26 December 2006 occurred at 10:40 UTC, with an epicentre approximately 8 kilometres north-north-west of the centre of Dumfries. The instrumental magnitude was determined at 3.6 ML, and initial reports suggested that the earthquake had been felt throughout Dumfries and Galloway. A macroseismic survey was launched on the BGS �Earthquakes� web site. A total of 301 responses were received.
The questionnaires were arranged by location into squares 5x5 km, and an intensity value was assigned to each square, provided at least four responses were received from that square. Where fewer responses were received (especially the case in sparsely populated areas) the intensity was either given as �felt� or �not felt� (which is also defined as intensity 1). The large number of replies received is partly a function of the strength of shaking in the most affected area, but is also influenced by the fact that the shock occurred in a populated area, not far from the town of Dumfries.
The highest intensity experienced over a significant area was 5 EMS (European Macroseismic Scale), which was observed over an area of over 230 sq km around the epicentre. There is evidence that locally the intensity reached 6 EMS at the actual epicentre. Unsurprisingly, Dumfries returned the highest number of replies (126). Areas that experienced intensities of up to 4 EMS were close-by communities of Lochmaben to the east (19 replies), New Abbey to the south (20 replies) and Bridge of Urr (4 replies).
Comments received described the particular effects people had experienced. These included descriptions of the noise made by the earthquake as sounding like an explosion or a sonic boom. Most people who reported having felt or heard the event described the shaking sensation as weak to moderate and the noise as soft to moderate. A few people reported objects, such as Christmas cards, falling over or pictures on walls being sent askew. In several reports it was stated that both wild and domestic animals were alarmed. There were some reports of damage to property, the worst being a single brick garage in Dumfries, where a wall was split from the top to halfway down and the crack which opened cut right through four of the bricks.
Examples of comments received were:
�Knocked some Christmas cards off the living room windowsill�
�First reaction was that a lorry had hit the house�
�People came out onto the street to see what was going on�
�I at first thought it was an explosion or aircraft impact or sound barrier being broken by aircraft�
�There was a loud bang and then the vibration under foot�
�Door slammed shut and a few cards falling off the mantelpiece�
�The whole experience was really scary�
�Everyone in the street came outside to see what the noise was�
�I was awoken by a noise, shaking and swaying of the house�
�perfume bottles were also chinking as they were being shaken on the shelf�
�Bath water showed ripples�
�Roof slates and timbers rattled and shook�
�The whole room appeared to shake violently sideways�
The most distant reports (between approximately 60 � 100 kilometres) were mainly from north-north-west of the epicentre, from around the areas of Strathaven, southern Glasgow and Paisley. Possibly the shaking was locally enhanced by the sediments of the Clyde valley. There was also one report of shaking having been felt close to Stranraer, approximately 95 kilometres to the west of the epicentre. The total felt area for isoseismals 3-5 is over 3,600 sq km. The areas within each isoseismal were as follows:
| Isoseismal | Area (sq km) |
|---|---|
| 3 | 3,600 |
| 4 | 1,300 |
| 5 | 200 |
Table 1 - Isoseismal areas
Parameters for the earthquake were calculated from these macroseismic data. The magnitude was calculated to be 3.5 ML. The macroseismic depth is around 5-6 km, compared to the instrumental determination of 7.7 km. The macroseismic epicentre is at 55.08 N 3.66 W. In all three parameters, the differences between the macroseismic and instrumental parameters are less than the associated uncertainties. In fact, the agreement is really very good. The distribution of intensity data points is in close agreement with what would be expected from standard UK intensity attenuation, as described in Musson (2005).
This earthquake is typical of those in historical experience in this area. Between Dumfries and Lockerbie is a small area where seismic activity is regular, but confined to small magnitude events. The seismic history was investigated by Musson (1987), the earliest traceable event being the 1775 Annandale earthquake (2.9 ML). The largest previous earthquake in the Dumfries-Lockerbie zone was the 1888 Lockerbie event, with a magnitude of 3.4 ML. Thus the recent event is now the largest earthquake in this part of Southern Scotland.
This is in contrast to adjacent parts of Southern Scotland, which are virtually aseismic, and to the Carlisle area just to the south across the border, which is capable of producing earthquakes at least as large as 4.7 ML (in 1650 and 1979).
Musson, R.M.W., 1987. Seismicity of Southwest Scotland and Northwest England; with a catalogue of earthquakes within 75 km of Chapelcross, BGS Global Seismology Report No 316.
Musson, R.M.W., 2005. Intensity attenuation in the UK, Journal of Seismology, vol 9 no 1, pp 73-86.
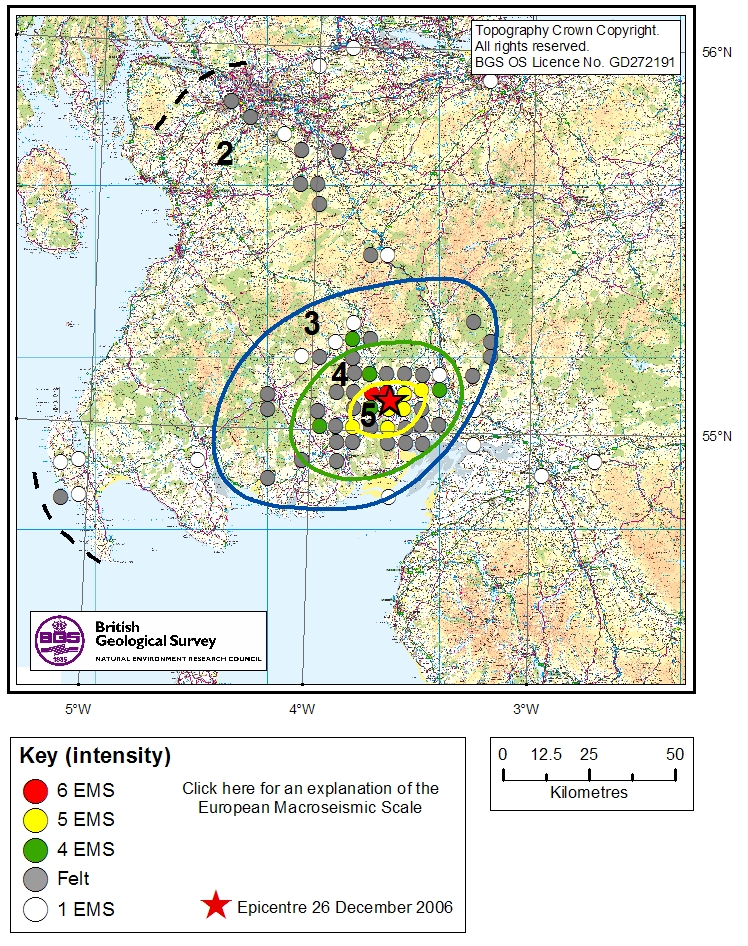
Figure 1. Isoseismal lines have been drawn for intensity
5, 4, 3 and 2 EMS.
Click on map for higher quality printable version.
The use of Ordnance Survey topography
above is for display purposes to assist the user in locating the seismic
event described. For information regarding copyright limitations,
please refer to: BGS copyright pages
Issued 18 January 2007