Eskdalemuir earthquake sequence: October 2004 to April 2005
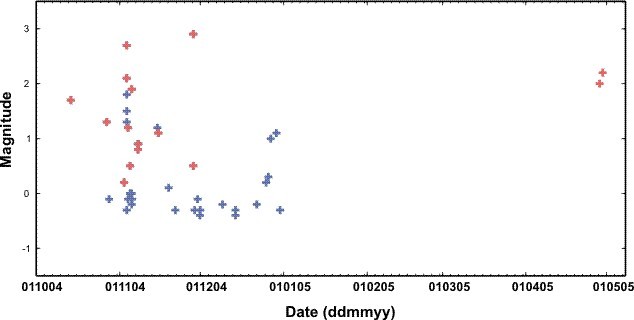
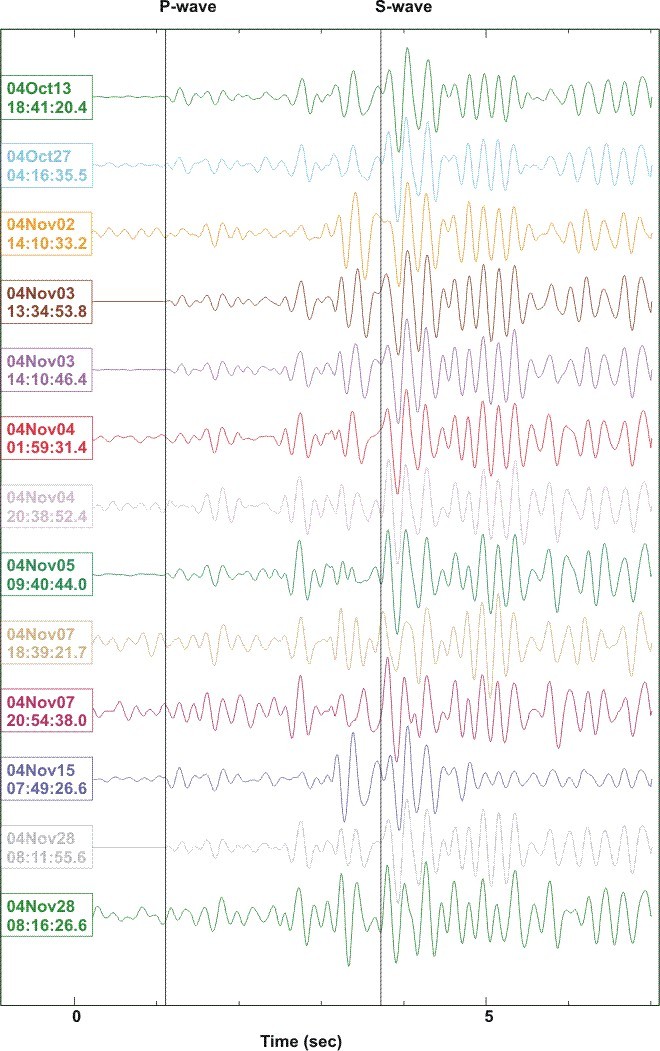
Eskdalemuir Earthquakes Latest Information - 30 April 2005 High correlation of waveform signals was observed from a sequence of earthquakes in 2004/2005 near Eskdalemuir, similar to Manchester 2002, Aberfoyle 2003 and Bridgwater 2004. Cross-correlation techniques were applied to these events in order to better resolve relative locations. The results are encouraging, and suggest that further application of this method will lead to a better understanding of seismotectonics in the UK. A total of 39 earthquakes were recorded about 15km southeast of Eskdalemuir between 13 October and 30 December 2004 (Figure 1, Figure 2). Two additional earthquakes were recorded on April 28 and April 29, 2005, with similar characteristics. Ten of the events were felt at nearby villages. The two largest events occurred on 3 November at 13:34 (UTC) and 28 November at 08:11 with magnitudes 2.7ML and 2.9ML, respectively. Due to the proximity of the earthquakes to the seismograph station and the seismic array at Eskdalemuir, it was possible to detect small events with magnitude down to -0.4ML. In order to obtain an as complete list of events as possible, continuous data were collected from the station at Eskdalemuir. Events were then identified from continuous plots and entered into the database. In addition, data from the seismic array at Eskdalemuir that is operated by AWE Blacknest were combined with the BGS data (see cross shaped configuration of seismic stations in Figure 1). It was determined from the routine locations that the spatial extent of the earthquake source region was less than a few kilometres and, therefore, a cross-correlation technique was applied to identify groups of similar events. This revealed three groups of similar events consisting of 15, 3 and 2 events, respectively. Seismograms for events of the main group are shown in Figure 3 showing that both timing of the various phases as well as the amplitude ratio between the phases are nearly identical. This group contains the two largest earthquakes, which suggests that these two events had a similar hypocentre location and source mechanism. The main group also includes the two events of April 2005. The fault plane solutions for the two largest events were determined from first motion polarities and amplitude ratios, and are quite similar indeed (Figure 1). The focal mechanisms show normal faulting with the two nodal planes striking in N to NNW direction and dipping either west or east. The focal mechanism determined for these two events is also valid for the other events in the main group. Accurate and consistent phase arrivals were determined for events of the largest group applying the cross-correlation technique. The resulting phase arrivals were used together with the manually picked arrivals for the other events as input to a joint location procedure. The lateral spread of the epicentre distribution was slightly reduced compared to the routine individual locations. The majority of the earthquakes originate from an area about 2.5km in north-south and 1km in east-west direction. The two events located south of the main cluster belong to a group of two events that were identified to have similar waveforms. The distribution of epicentres is clustered and shows no clear linear trend that may indicate a fault plane. The larger faults in the region are oriented southwest-northeast and thus perpendicular to the nodal planes of the two largest events in the sequence. Event distribution and tectonic information, therefore, cannot be used to identify one of the nodal planes as causative fault. While the events in the main group share the same mechanism with the two largest events, the difference in the waveforms suggest that the remaining events have a different source mechanism.  Figure 1. Epicentre locations (red circles) of earthquake sequence near Eskdalemuir seismograph stations (yellow triangles) and fault lines (black lines). The inset maps give a more detailed map of the main cluster (top) and the fault plane solutions of the two largest events in the sequence (bottom). The use of Ordnance Survey topography is for display purposes to assist the user in locating the seismic event described. For information regarding copyright limitations, please refer to: http://www.bgs.ac.uk/about/buscopy.html
|