| Preliminary results from analysis of seismograph recordings of the explosion near Hemel Hempstead 16 December 2005 The explosion of the Buncefield fuel depot near Hemel Hempstead on 11 December 2005 is considered to be the largest in peacetime Britain. Explosions generally release most of their energy into the air as shock-waves, but some energy is also transmitted into the ground as seismic waves. Both can be detected on seismograph stations (instruments that are sensitive to ground vibrations) at a distance from the source. In the UK, quarry blasts and underwater explosions are frequently detected on the seismograph network. These recordings can be used to determine the time and location of the explosion. The explosion near Hemel Hempstead was recorded on the
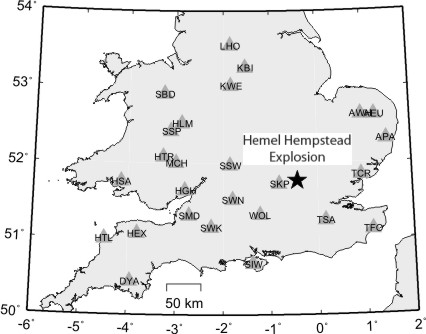
UK seismograph network operated by the British Geological Survey (Figure
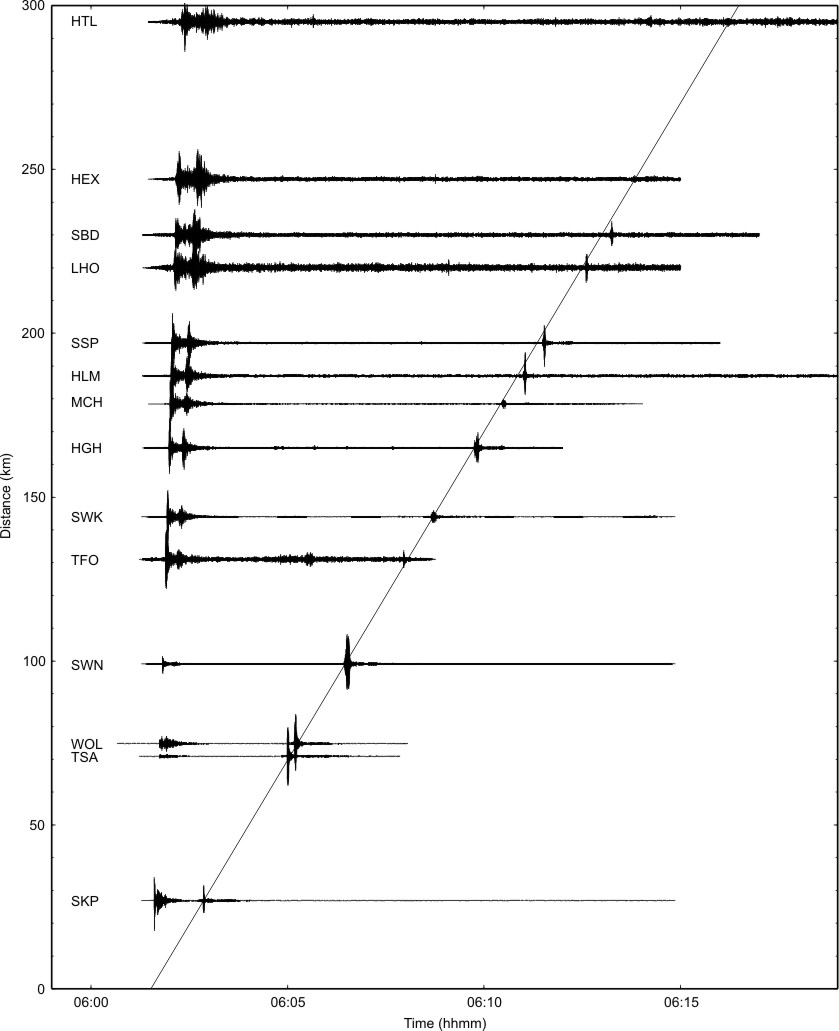
1), at distances of up to 300km. Figure 2 shows seismograms recorded on selected stations as a function of distance. The initial signals are the seismic waves, both P- and S-waves (S only beyond about 100km) can be seen. The explosion source releases compressional P-waves, however, S-waves are also generated due to scattering. The later signal along the straight line shows the air-waves that arrive much later. Velocities are on the order of 6-8km/s for the seismic waves, but only 0.334km/s for the air-waves (speed of sound in air). Using the seismic P wave arrivals, and knowing the exact location (0.427W/51.766N), the origin time of the event was determined at 06:01:31.28 (UT). Seismic waves are observed up to about 300km from the source. Air-waves are picked up by the seismometers up to about 230km.
Preliminary results from analysis of the survey instigated in response to the explosion near Hemel Hempstead
FELT EFFECTS OF THE HEMEL HEMPSTEAD EXPLOSION OF 11 DECEMBER 2005 Initial reports suggested that the event was felt throughout the south of England. To study the felt effects of the explosion a survey was carried out. Members of the public were invited to complete the questionnaire on the BGS "Earthquakes" web site. Over 3000 completed questionnaires were returned, enabling us to produce the maps below. The results confirmed that the explosion was felt throughout a large part of England, with the most distant reports coming from as far north as Lancashire, West Yorkshire and Humberside, and as far west as Powys, Mid Glamorgan and Somerset. Most reports of damage to property came from within a radius of 7km from the blast site. Examples of damage include: ‘three windows smashed’ from a house 1.4km to the southeast of the explosion; ‘French windows were blown in’ from 5.6km to the east; 'loft-hatch made of glass shattered' from 7km to the south; ‘roof tiles dislodged and fell to ground' from 3.7km to the northeast; ‘many windows shattered, one neighbour had a 42” TV blown across the lounge’ from 1.6km to the northwest; and ‘windows smashed and glass came in all over the bed and floor’ from 1.0km to the northwest. Numerous comments were received from people about the particular effects they felt. These included reports of car alarms being triggered, doors swinging open and closing, guttering and drainpipes rattling, banging noises, windows rattling, loft hatches being blown open and items of furniture being moved. Many people also reported that they had been woken up.
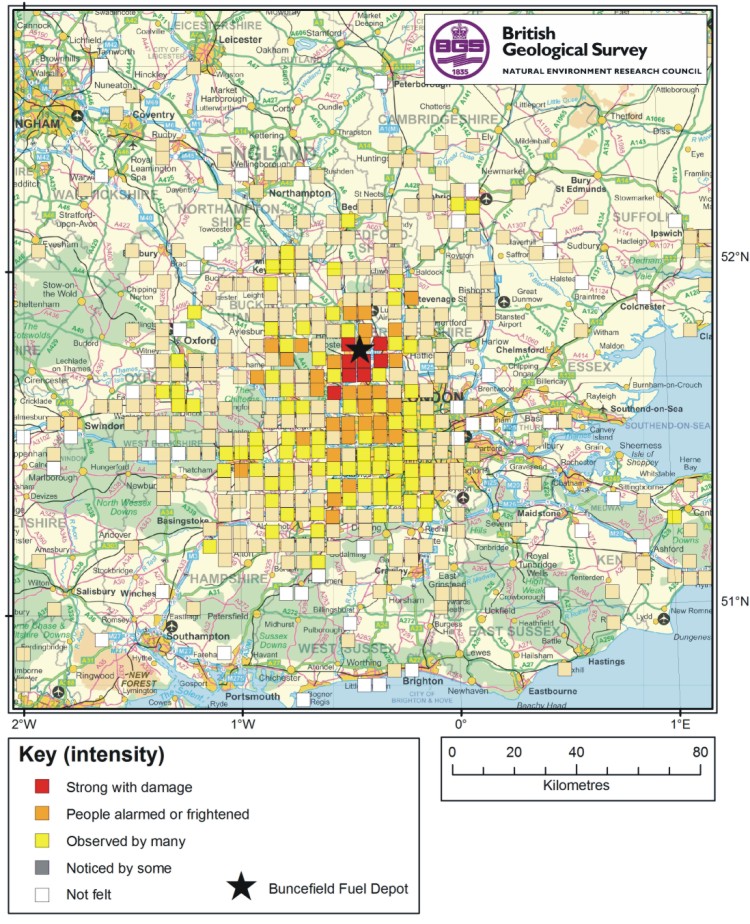
Figure 1. The contour map above shows the extent of the felt effects of the blast and also where it was felt most strongly. However, it is interesting to examine these results more closely, as shown in the next two diagrams.
Figure 2. Map showing the intensities with which the blast was felt, represnted by each 5x5 km grid square.
Figure 3. Map of numbers of questionnaires received for each grid square. This shows the number of responses on which the strength estimates are based. The use of Ordnance Survey topography above is for display purposes to assist the user in locating the seismic event described. For information regarding copyright limitations, please refer to: http://www.bgs.ac.uk/about/buscopy.html
Links: BBC - http://www.bbc.co.uk/threecounties/read_this/buncefield_explosions/ BBC - http://news.bbc.co.uk/1/hi/sci/tech/4541632.stm Issued 16 December 2005 |