Earthquakes near Newdigate, Surrey

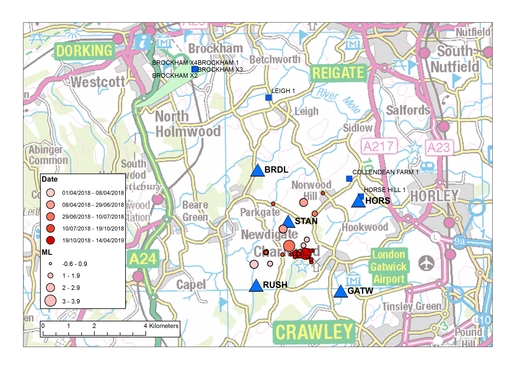
A sequence of small earthquakes started near Newdigate, Surrey, with a magnitude 2.6 ML event on 1 April 2018. Five other earthquakes with magnitudes of greater than 2.0 ML were recorded in 2018. The largest was on 5 July 2018, with a magnitude of 3.0 ML, and was preceded by two events with magnitudes of 2.6 and 2.4 ML on 27 and 29 June, then followed by seven aftershocks, the largest of which had a magnitude of 2.4 ML. Seven of the earthquakes in 2018 were felt by people living nearby and there was public concern that the earthquake sequence may have been triggered by nearby hydrocarbon exploration and production. Oil production at the nearby Brockham field resumed on 23 March 2018 after a two year hiatus. Information provided to the Oil and Gas Authority (OGA) by the operator of the nearby Horse Hill 1 well (HH-1) states that flow testing started on 9 July 2018, however, the earthquake sequence was already underway at this point.
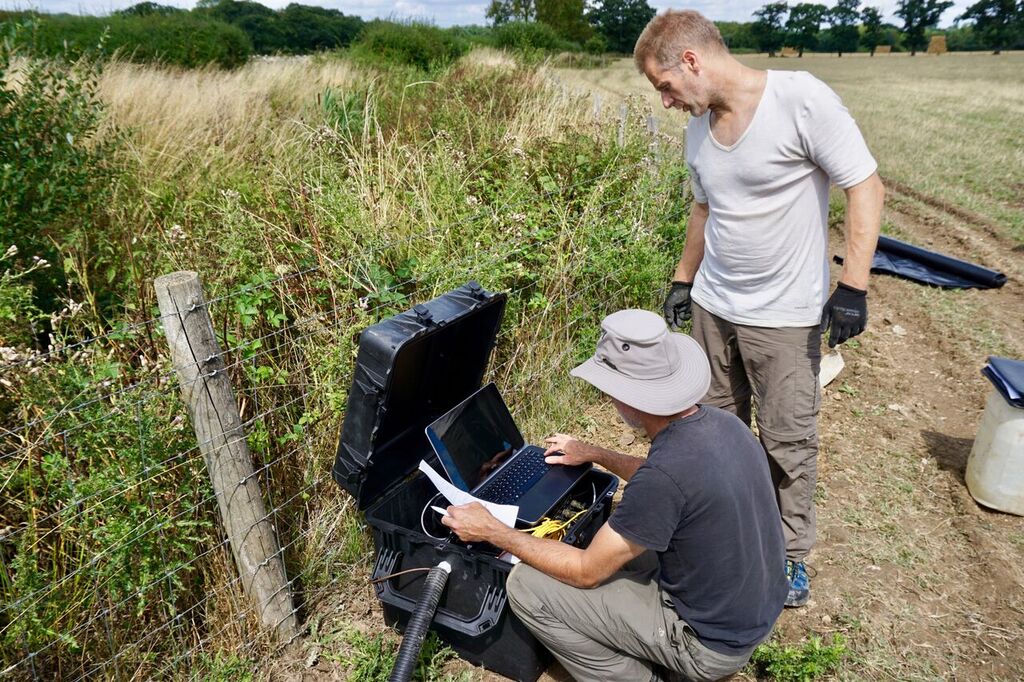
Five temporary sensors were installed by BGS in mid-July close to the epicentral area to study the events in more detail.
Further earthquakes with magnitudes of 2.4 and 2.0 ML were recorded on 14 and 19 February 2019, respectively. Both were felt by people nearby. These were followed by a magnitude 3.1 ML earthquake on 27 February, which was strongly felt locally.
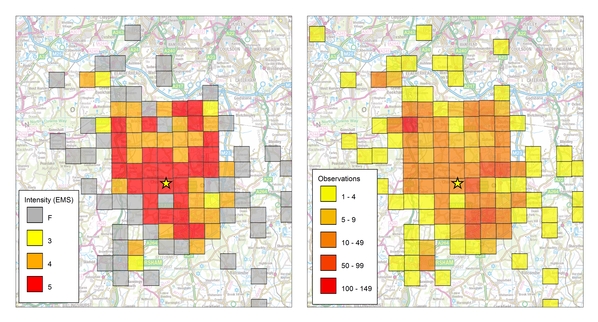
Our analysis shows that earthquake epicentres are tightly clustered in a small source zone that lies between the villages of Newdigate and Charlwood, and at a distance of approximately 8 km from the Brockham oil field and approximately 3 km from the Horse Hill 1 well (HH-1). The locations for events that occured after the temporary sensors were deployed in mid-July are the best constrained and show some alignment in an EW direction, just west of Charlwood, which is good agreement with the mapped EW faults that run through the region. Depths calculated using only local recordings suggest that the events are most likely to have occurred at depths of approximately 2 km. Production at both Brockham and HH-1 is from the Portland sandstone at a depth of approximately 600 m.BGS received over 1,600 reports from members of the public who felt the magnitude 3.1 ML earthquake on 27 February and these data were used to determine the strength of shaking in terms of macroseimic intensities. We find that intensities of 4-5 EMS were observed at distances of up to 10 km from the epicenter, but the event does not appear to have been felt beyond this, which is consistent with the shallow hypocenter. The European Macroseismic Scale (EMS) describes an intensity of 5 EMS as follows. "The earthquake is felt indoors by most and outdoors by few. Many sleeping people awake. A few run outdoors. Buildings tremble throughout. Hanging objects swing considerably. China and glasses clatter together. The vibration is strong. Top heavy objects topple over. Doors and windows swing open or shut."
A detailed report on the earthquake sequence was written for an Oil and Gas Authority (OGA) workshop on the events that was held on 3 October 2018. This can be found here. A report on the workshop is available on the OGA website: OGA Newdigate Seismicity Workshop - 3 october 2018. We used the criteria suggested by Davis and Frohlich (1993) to assess the available evidence that the earthquake sequence may have been induced. This suggests that the events are unlikely to have been induced.
The workshop led to further work by James Verdon (University of Bristol), Brian Baptie (British Geological Survey) and Julian Bommer (Imperial College London) to develop an improved framework for assessing whether earthquakes occurring near to subsurface industrial activity have a natural cause or are induced. The new approach was applied to the Newdigate sequence with the conclusion that neither Brockham nor HH-1 is a likely cause for the events, and they are therefore natural. This work has now been published in the peer reviewed journal Seismological Research Letters. A pre-print can be found here.
Such earthquake sequences or swarms are relatively common in Great Britain, examples include Comrie (1788-1801, 1839-46), Glenalmond (1970-72), Kintail (1974), Doune (1997), Blackford (1997-98, 2000-01), Constantine (1981, 1986, 1992-4), Johnstonebridge (mid 1980s), Dumfries (1991, 1999), Manchester (2002) and Aberfoyle (2003). Some of these occurred at relatively shallow depths in sedimentary basins, e.g. Johnstonebridge (mid 1980s), Dumfries (1991, 1999) and Manchester (2002).
The largest event in the Comrie sequence was a magnitude 4.8 ML event in 1839. The magnitudes of these historic events are determined from macroseismic observations and are calibrated against the instrumental local magnitude scale (Musson, 1996). The largest event in the Kintail earthquake swarm in 1974/1975 had a magnitude of 4.4 ML.
More recently, in 2012 a sequence of small earthquakes occurred on the island of Islay on the west coast of Scotland. The largest of the earthquakes had a magnitude of 2.8 ML, while two others had magnitudes in excess of 2.0 ML. At least eight of the earthquakes were felt by local residents. Similarly, in April 2014 there was a series of earthquakes near Oakham, Rutland. The two largest were on 17 and 18 April and had magnitudes of 3.2 ML and 3.5 ML, respectively. These were followed by a 3.8 ML earthquake in the same location on 28 January 2015. The earthquakes were widely felt across the East Midlands of England.
BGS's seismic monitoring provides an impartial source of earthquake data and calculated earthquake magnitude and location. Data from our stations are viewable on the real-time seismograms page of our website.
The BGS publishes detected events on our website page 'Earthquakes around the British Isles in the last 100 days'.
- BGS Environmental Baseline Monitoring
- Government guidance on fracking: developing shale oil and gas in the UK
- Royal Society and Royal Academy of Engineering review of the risks associated with hydraulic fracturing during shale gas exploration and production
- National Research Council, 2012. Induced seismicity potential in energy technologies, National Academies Press
- Seismological Research Letters: Special Issue on Injection-Induced Seismicity.
- British Geological Survey Shale Gas Project


